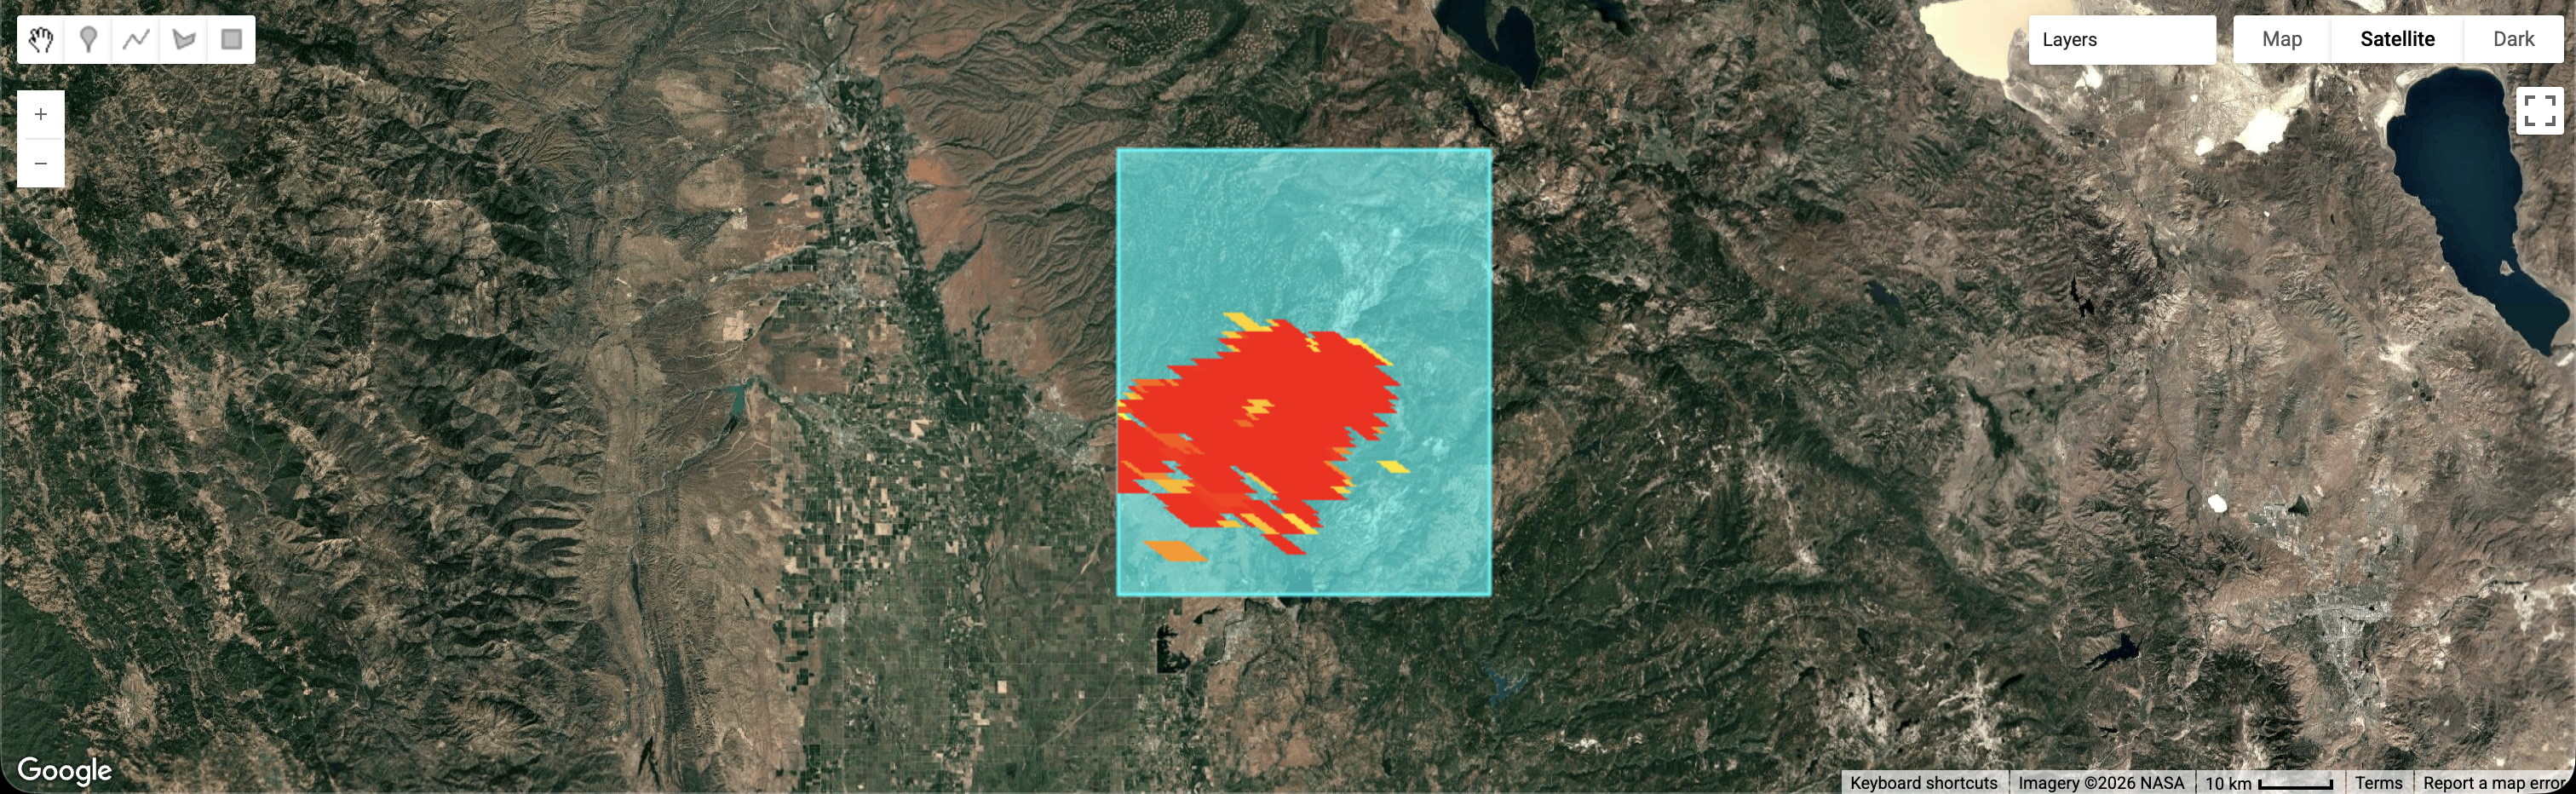
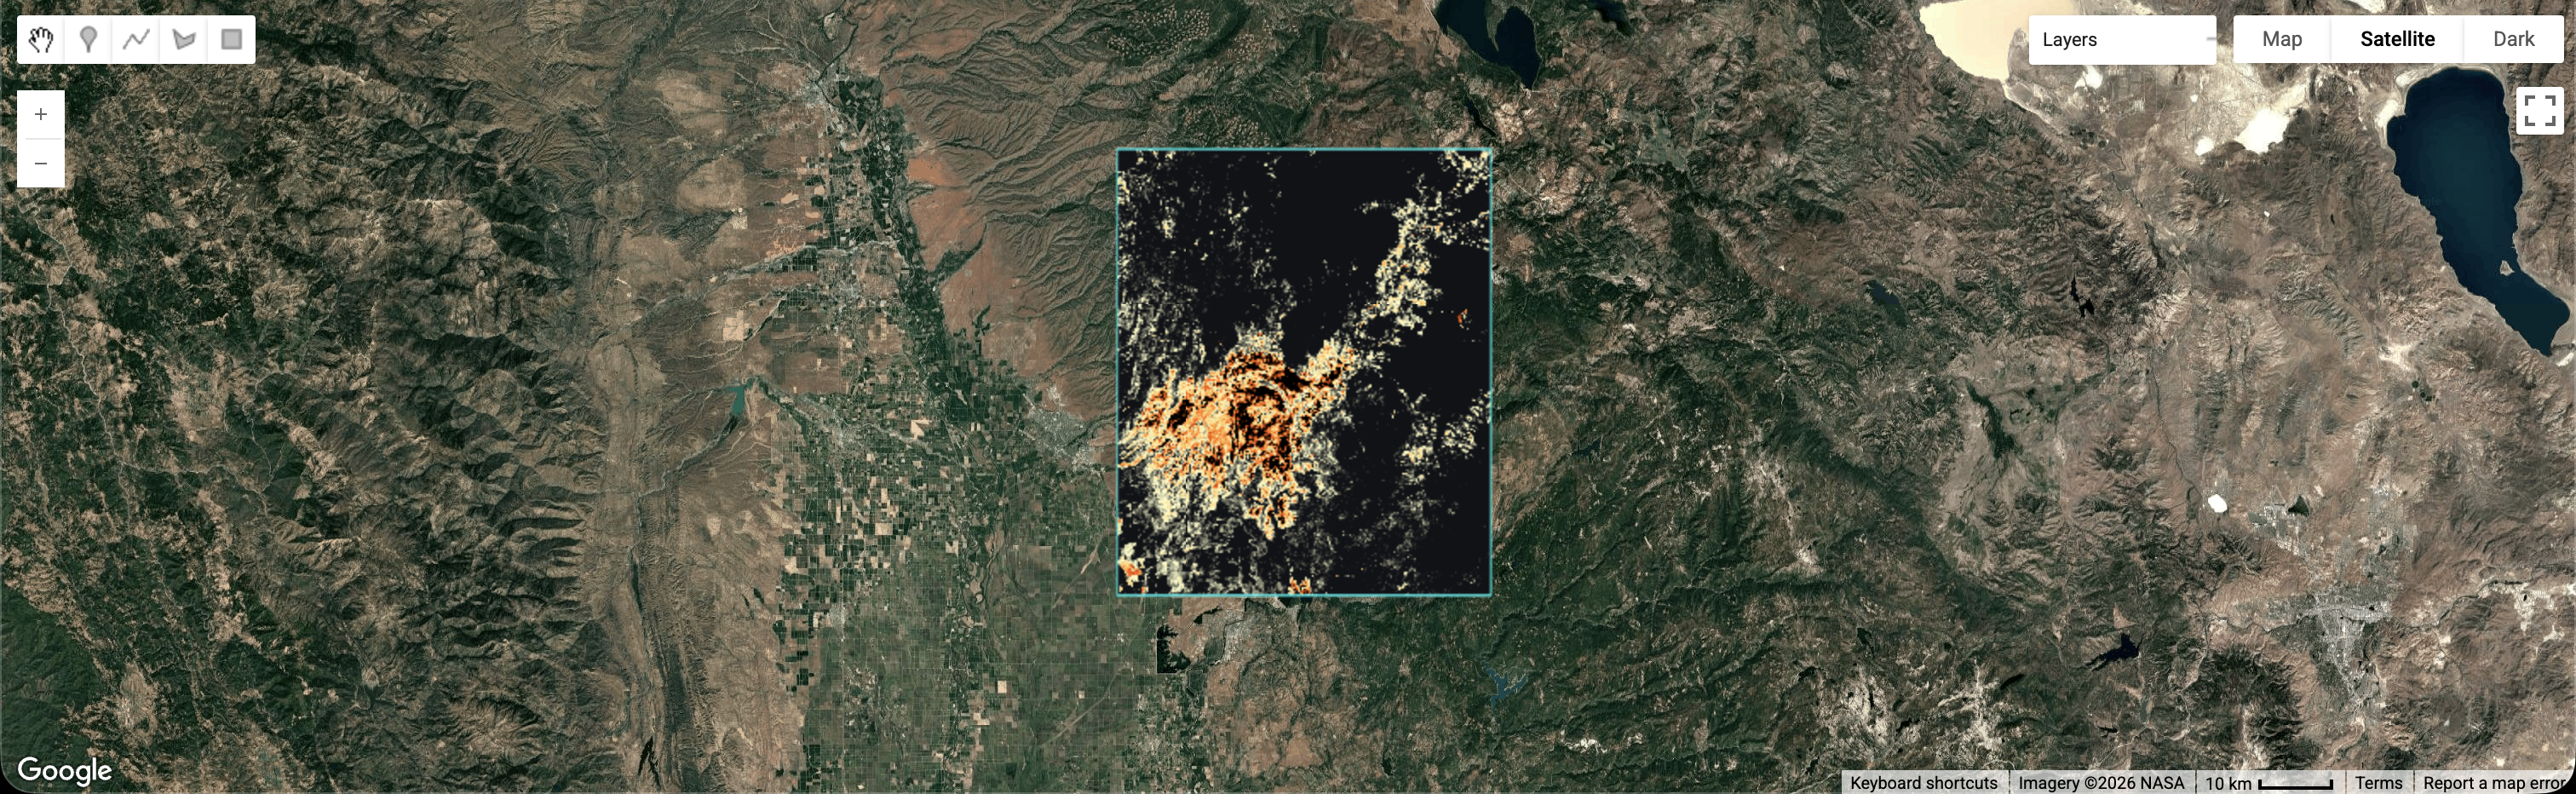
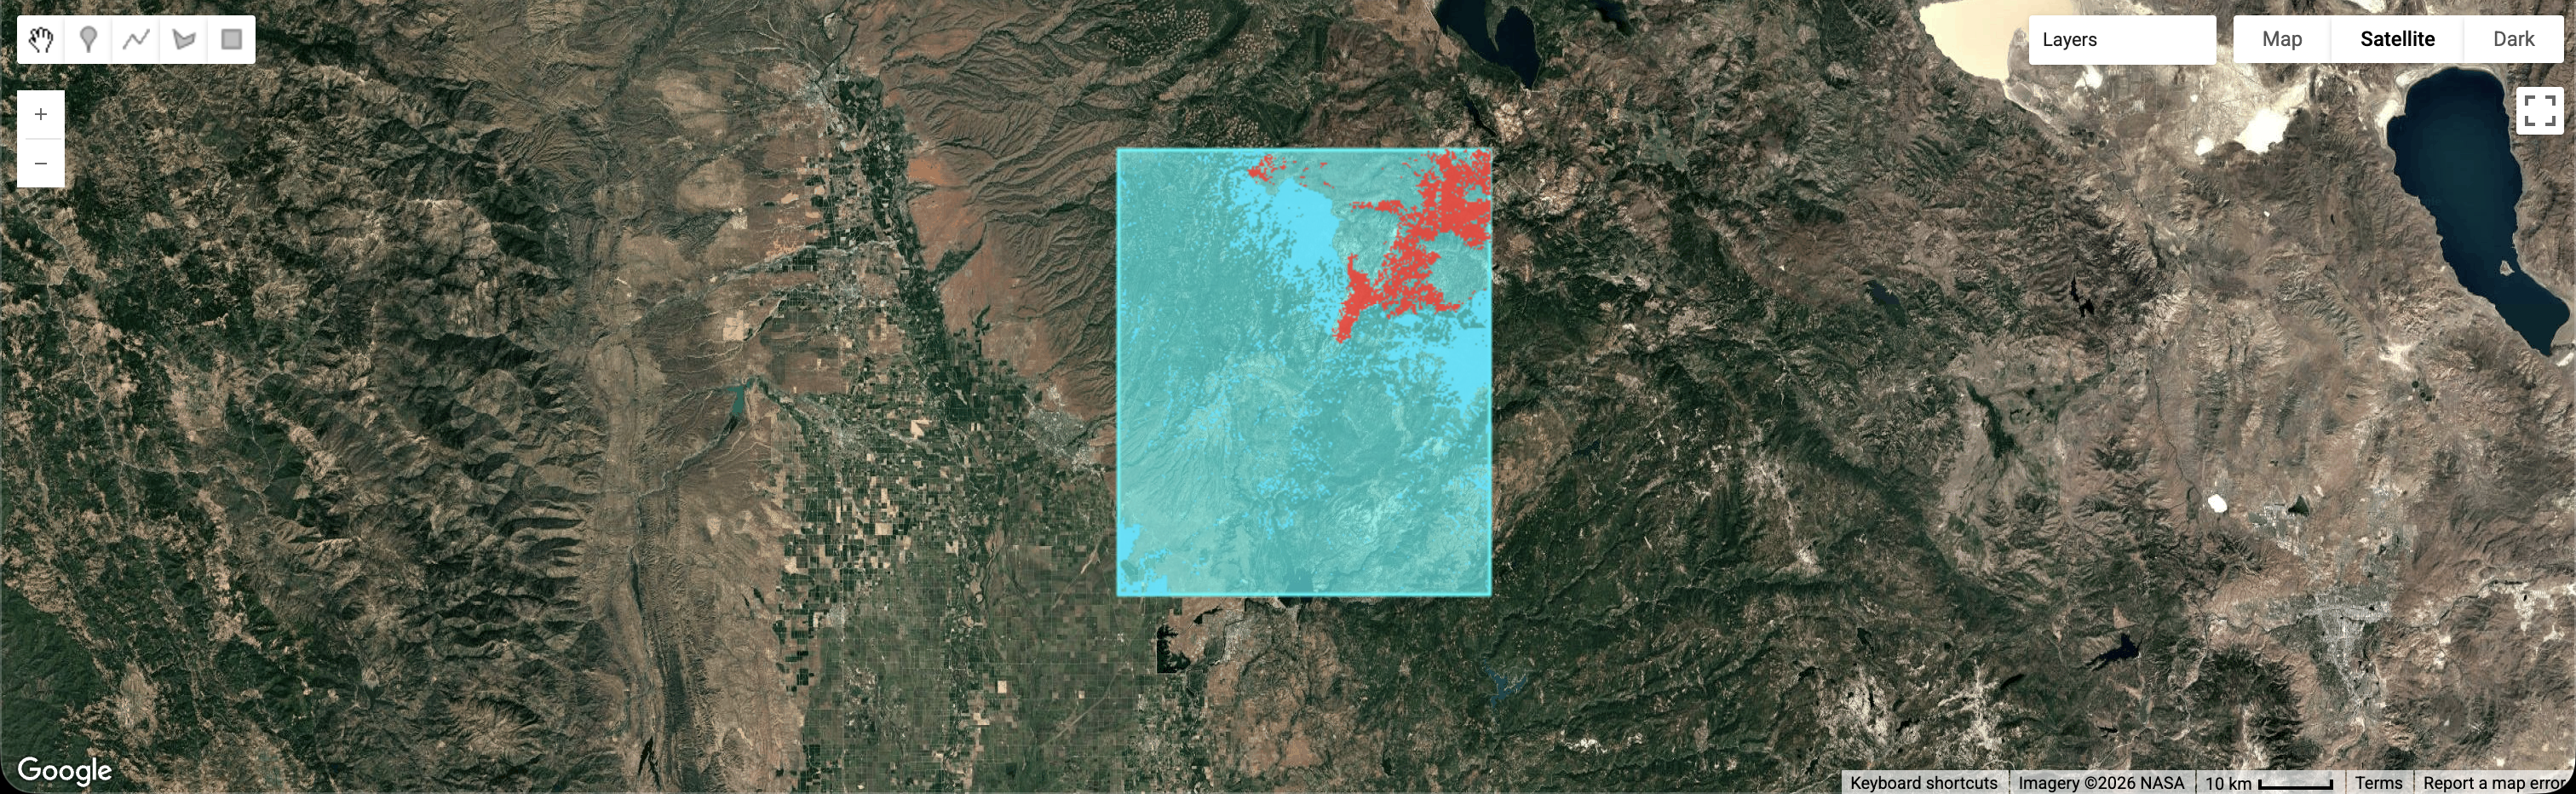
Step A — Vision Transformer (ViT)
The model scans the forest in 256×256 pixel patches, learning textures and spatial patterns:
smoke vs. clouds, and heat signatures that move like a fire line.
- Inputs: optical + thermal imagery
- Outputs: probabilities (e.g., “smoke”, “active front”, “heat anomaly”)
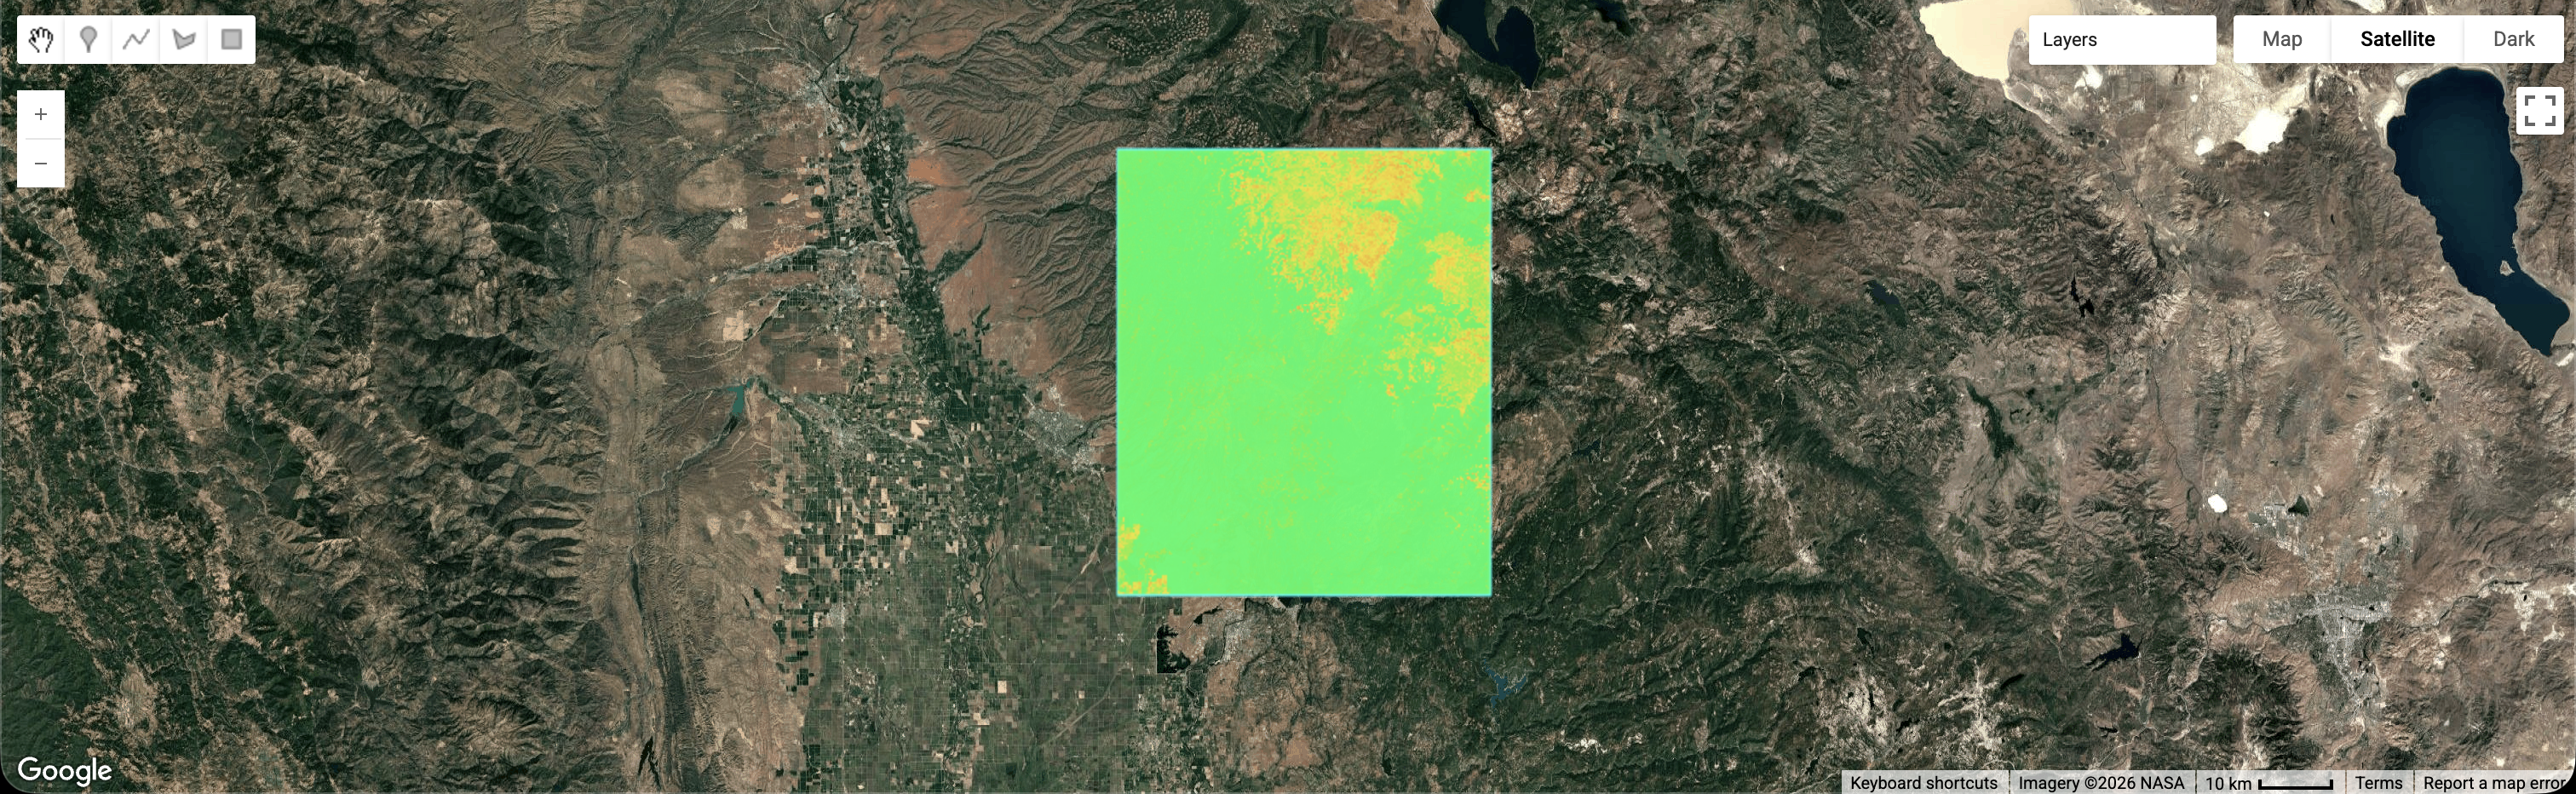
Step B — Fuzzification Layer (ANFIS)
Crisp sensor values become fuzzy sets — the system “thinks” in degrees of truth.
Example
Wind = 28 km/h → Calm: 0.0 · Breezy: 0.3 · Gale: 0.7
- Handles uncertainty (clouds, mixed pixels, noisy weather)
- Improves stability versus hard thresholds
Step C — Expert Rule-Base
This is where we encode fire-science logic. Thousands of rules can apply simultaneously,
producing an interpretable alert level.
Rule #402
IF Smoke AND Fuel is Arid AND Wind is High → Alert = Catastrophic
Rule #815
IF Smoke BUT Soil is Saturated → Alert = Low (likely controlled burn)
- Produces a human-readable explanation (“which rules fired”)
- Supports auditing and improves trust for the jury
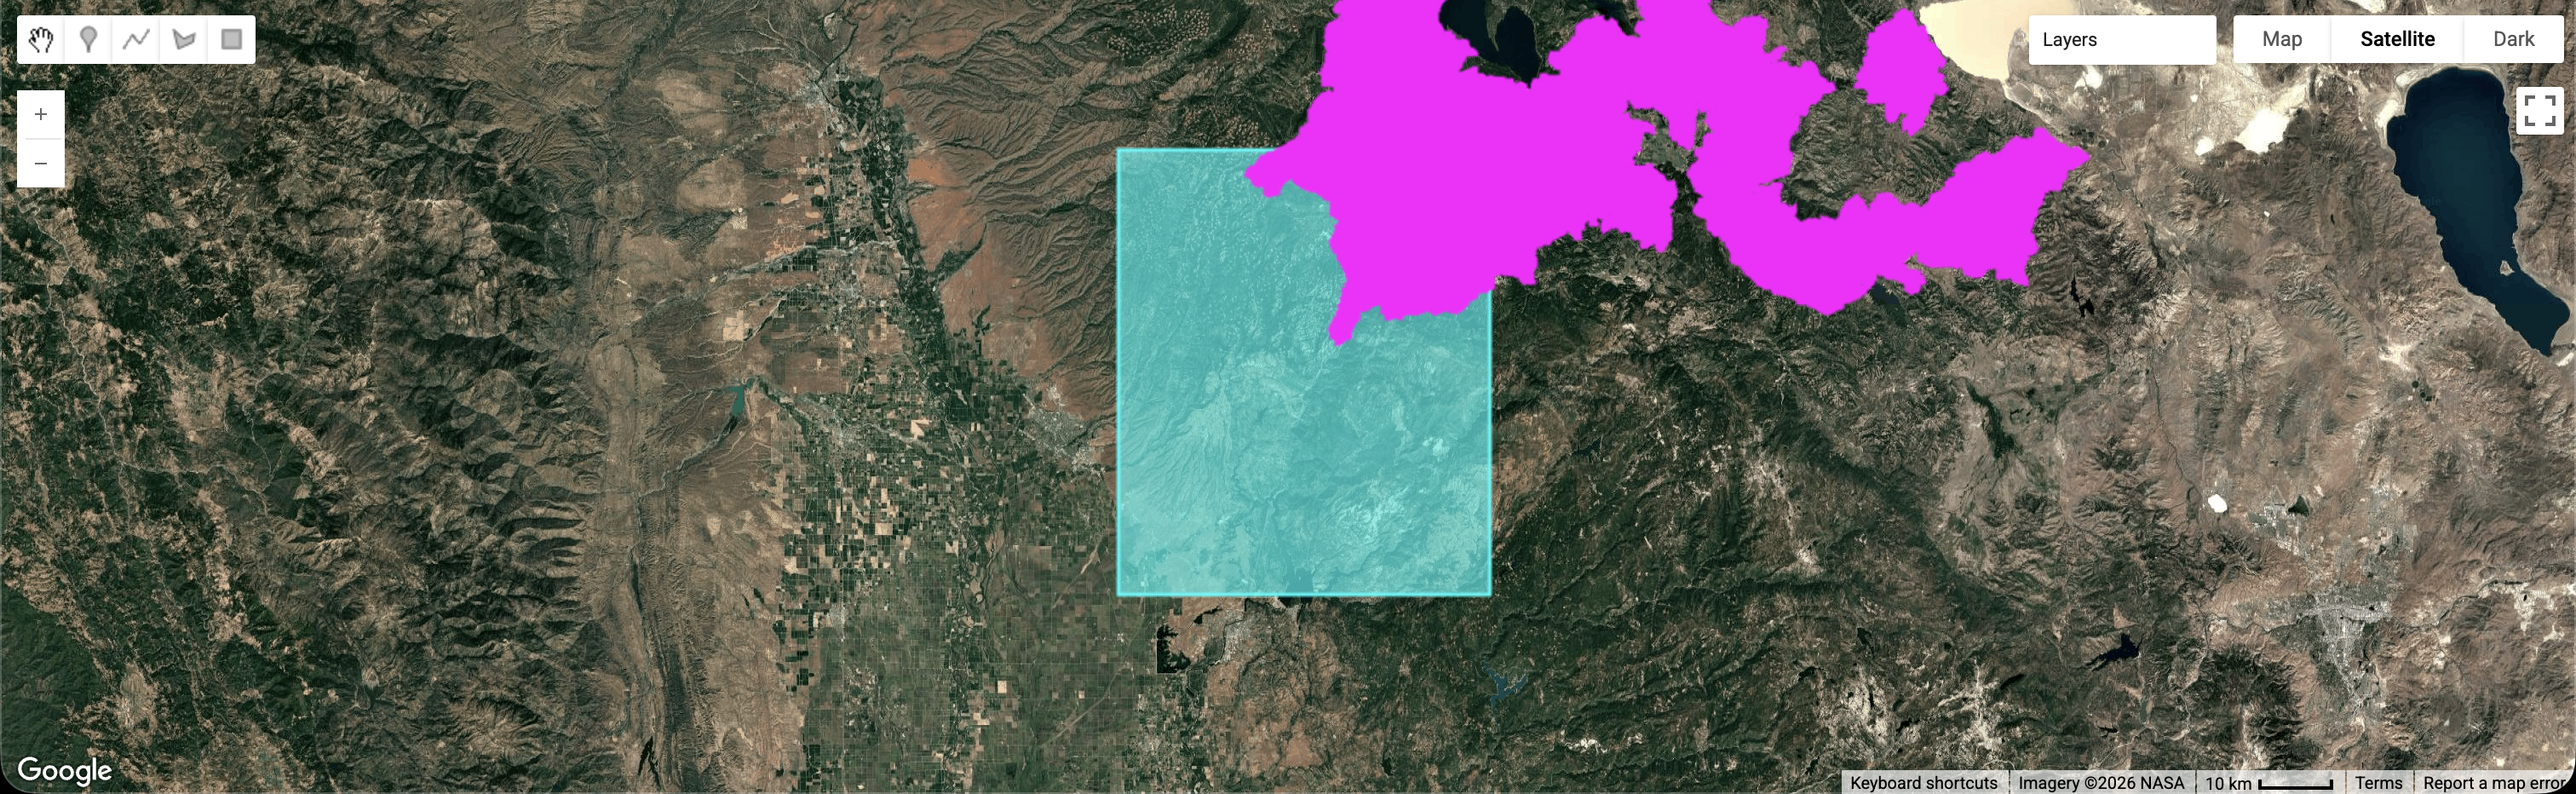
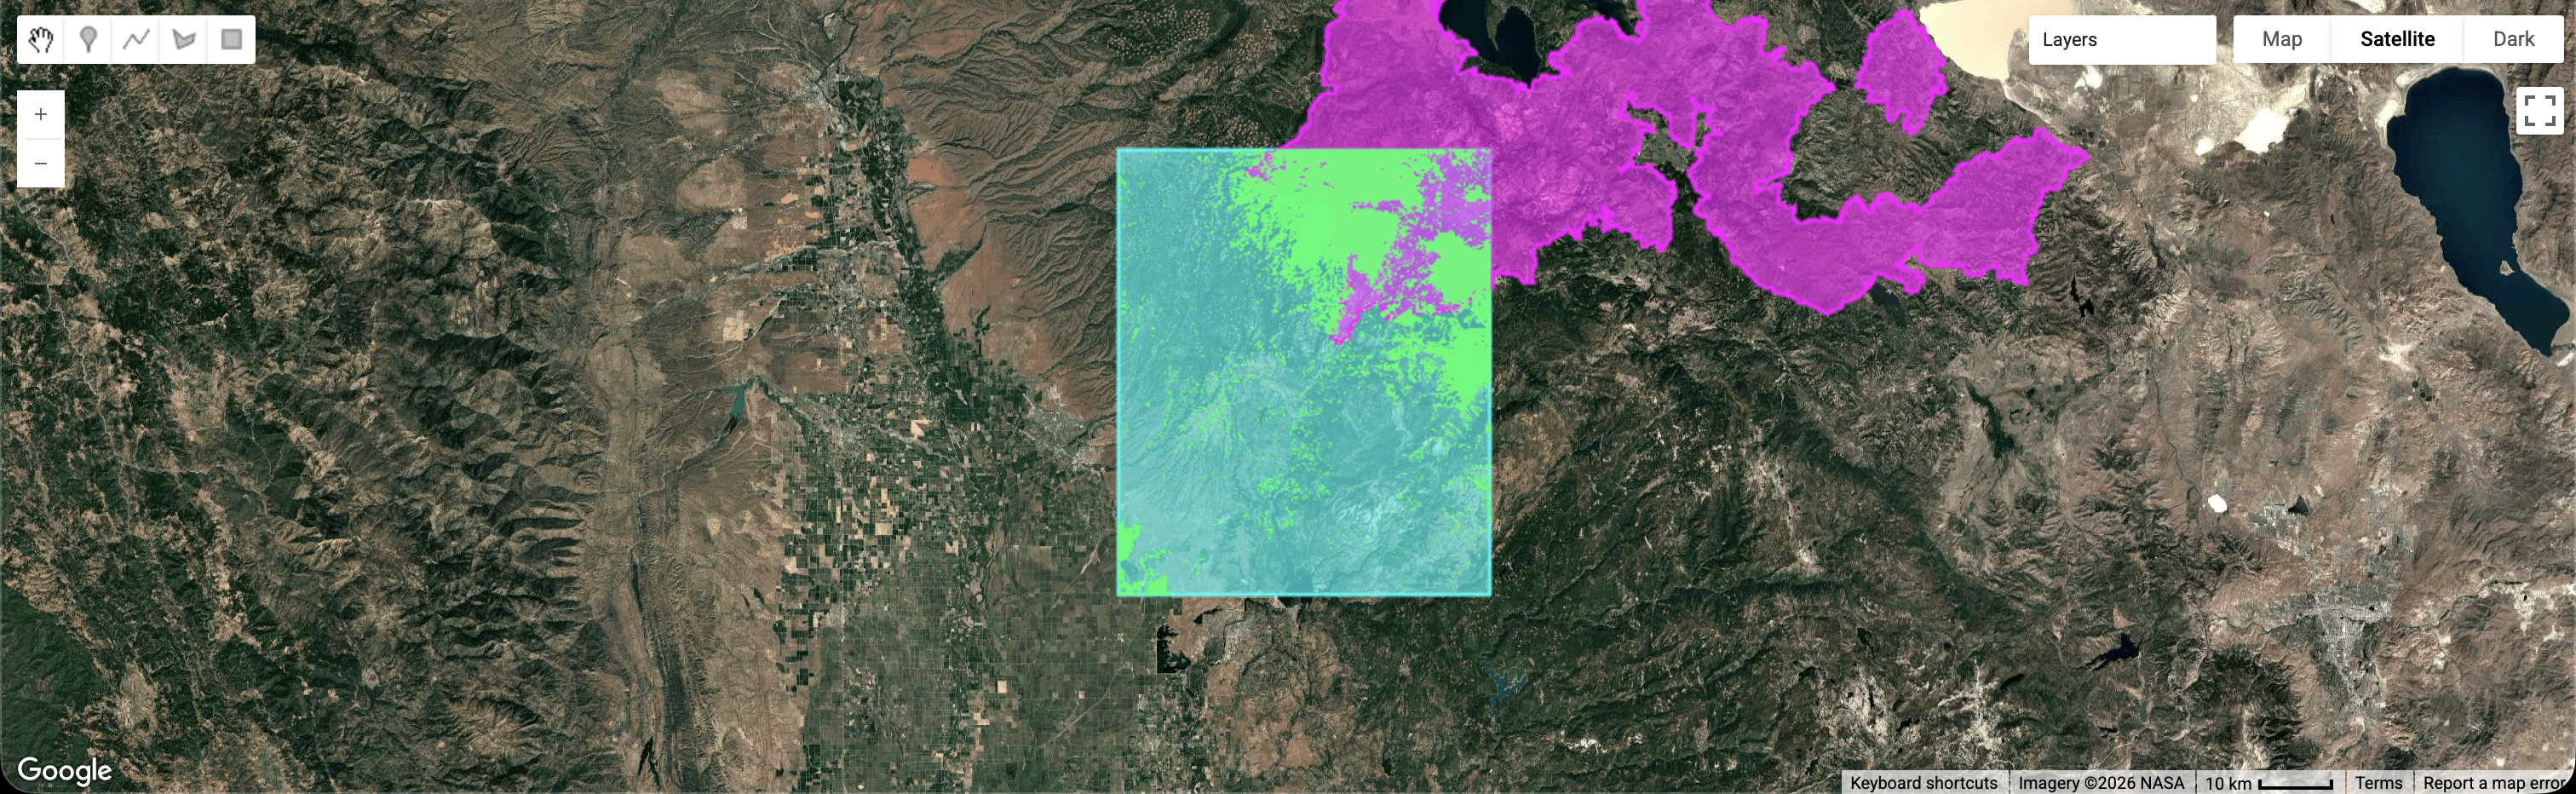
Ignition Logic — Possible Causes (Human Risk)
To be precise, we add anthropogenic risk signals that often explain where ignitions happen.
- Road proximity: higher risk within ~100 m of roads
- Power line overlay: extra watch during high-wind events
- Leisure activity: higher risk near campsites on weekends/holidays
These factors don’t “force” the answer — they adjust the fuzzy risk score and provide context.
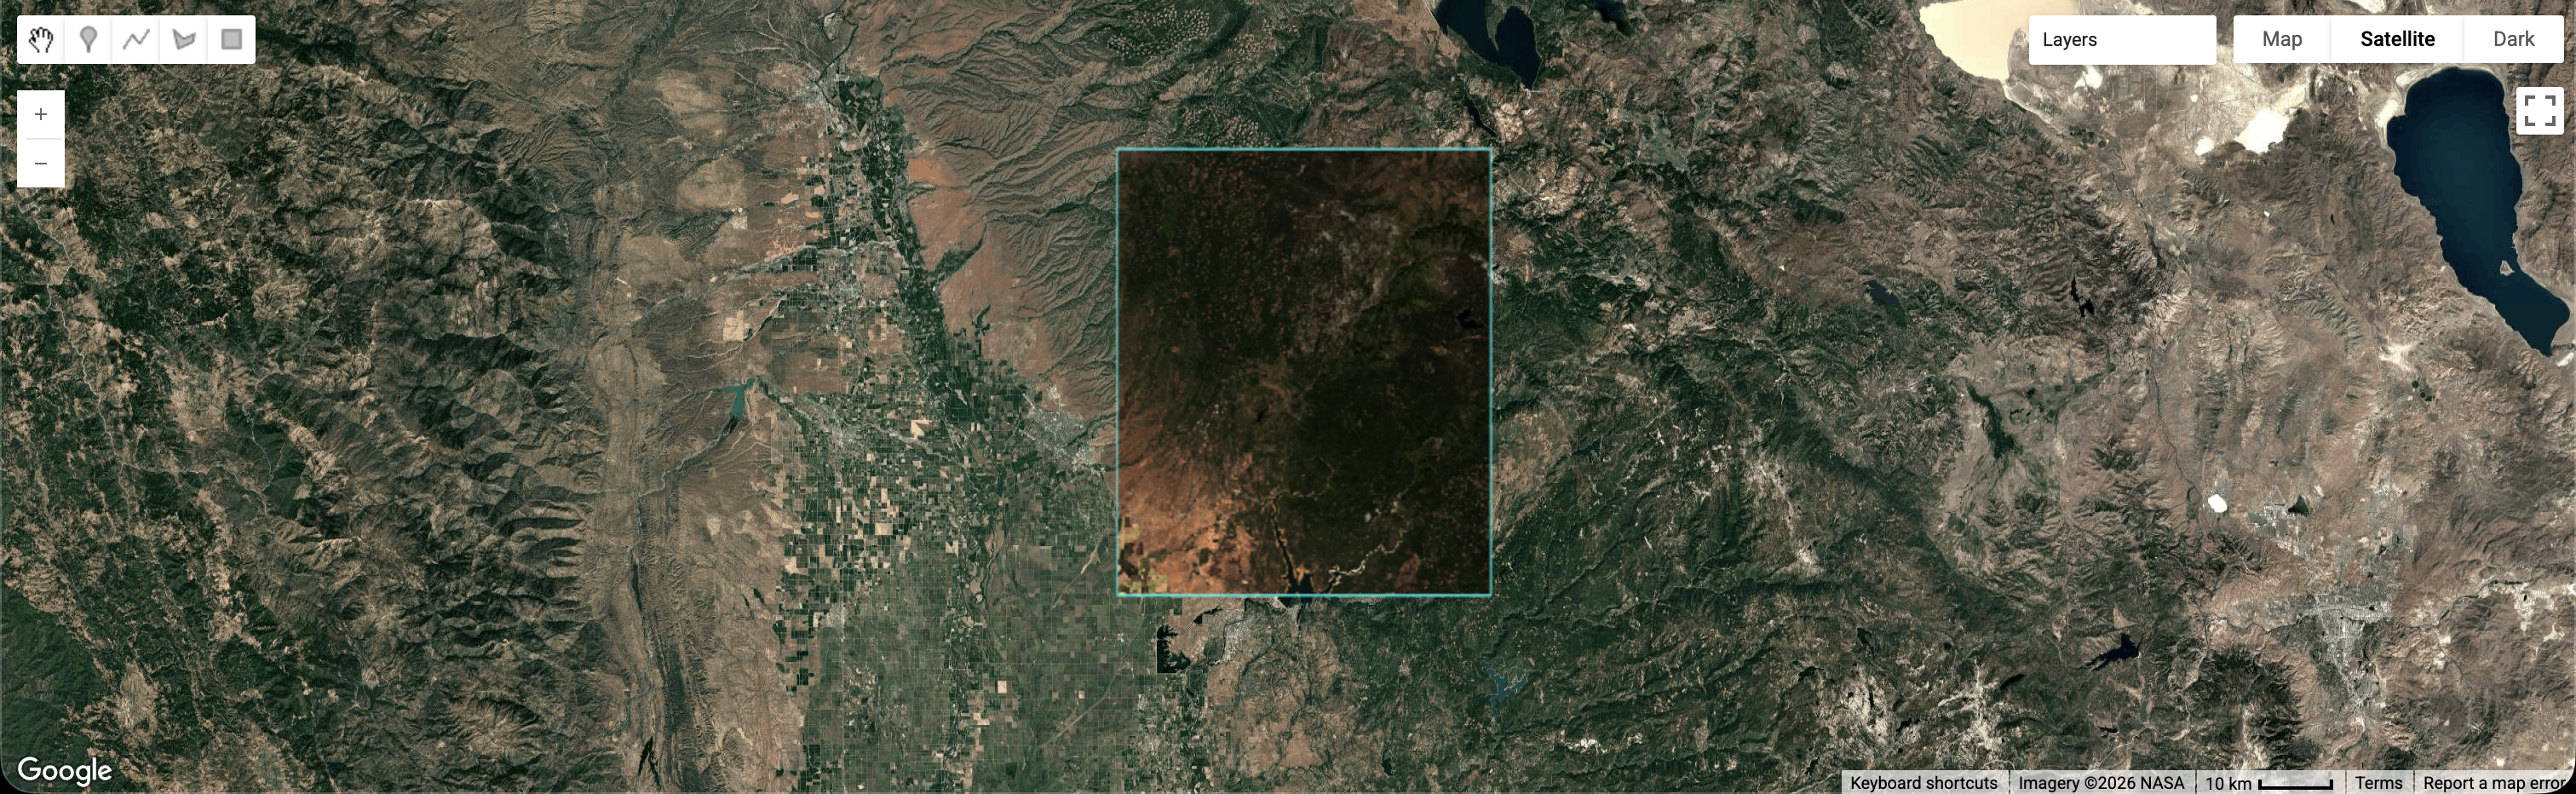
Screen
Sentinel-2 (optical) every ~5 days → vegetation stress & smoke context
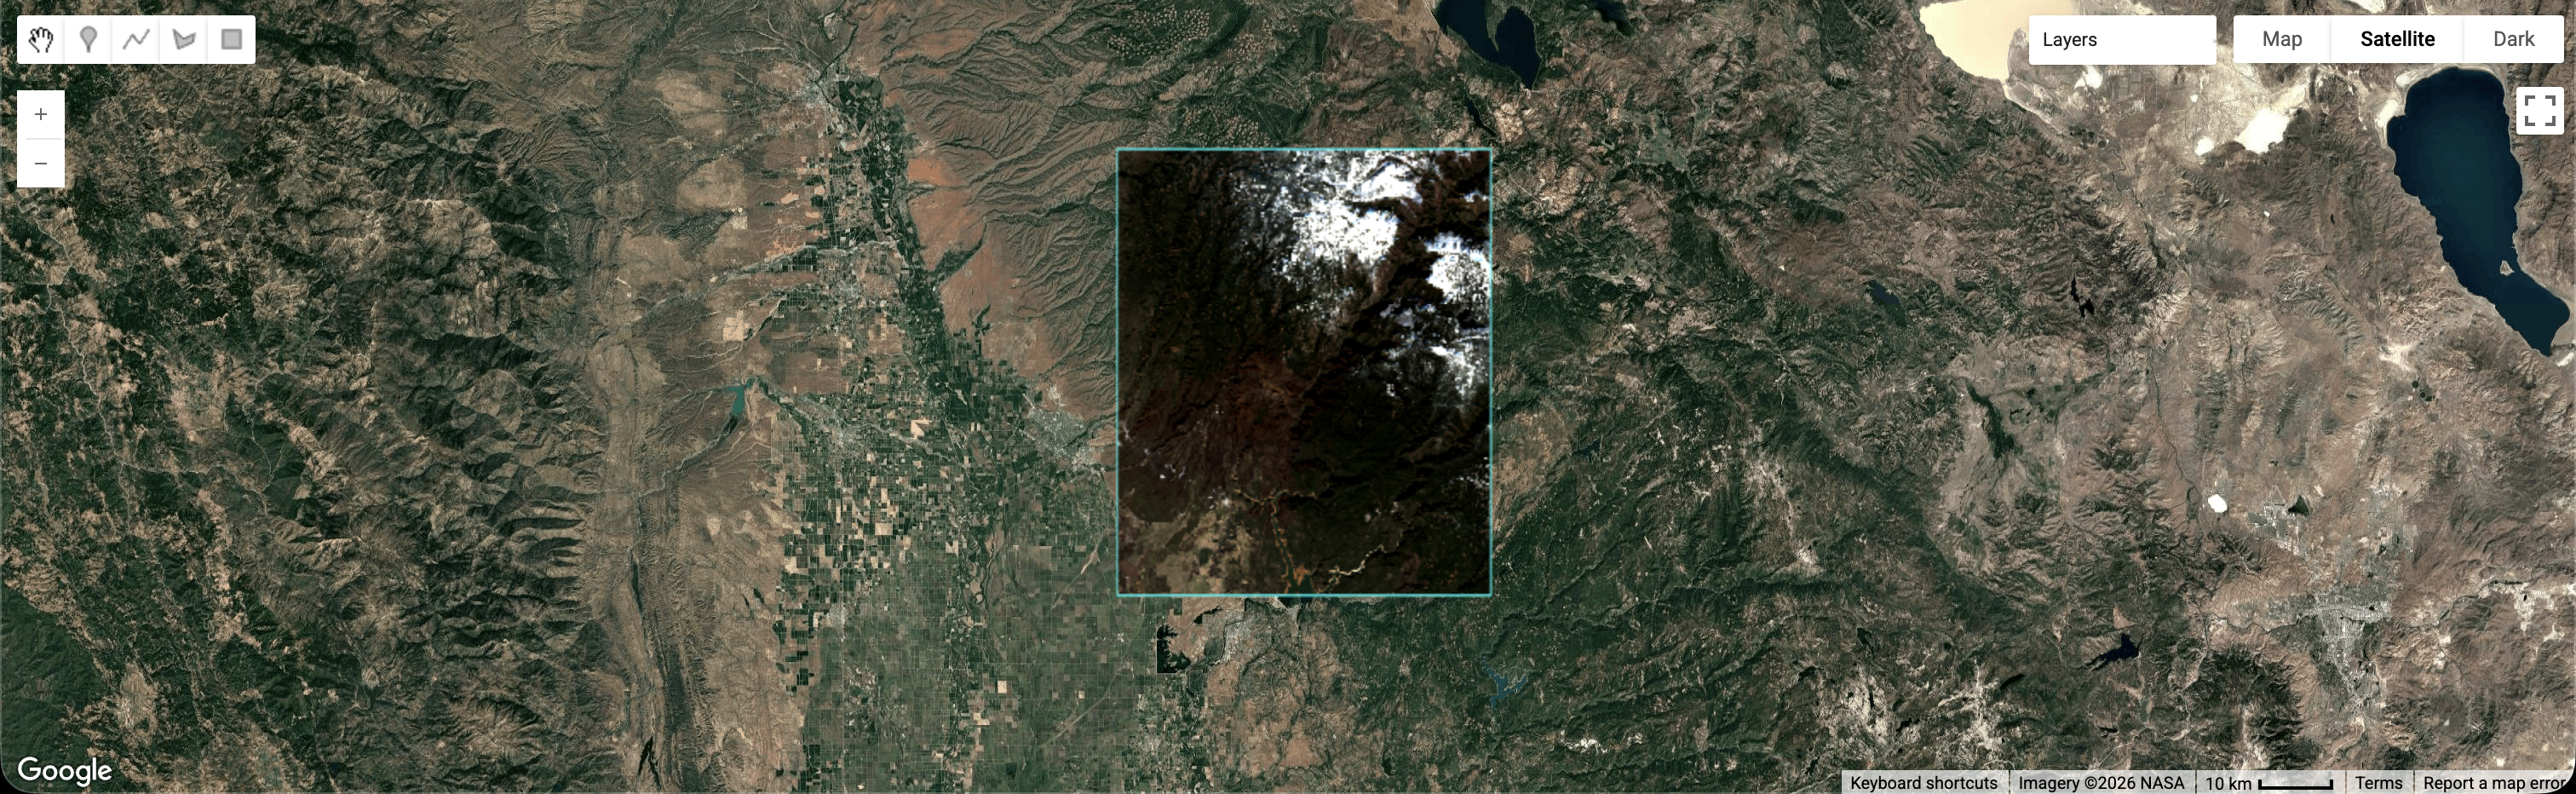
Monitor
VIIRS (thermal) every ~12 hours → hotspots & heat anomalies
Process
ViT + ANFIS fusion with live wind/temperature → probability + explainable alert
Confirm
If Risk > 85% → auto-task high-res imagery (e.g., Planet) at exact coordinates
Notify
Automated message to owner (“Sector 4 risk”) + fire department (GPS + confidence)